Office · Module 04 of 20
Courses
A course is the join between a subject, a class and an academic year — and it is where the curriculum framework is chosen. Everything families eventually see about academics hangs off a course record.
- Route
- /office/courses
- Captured in
- Chrome
- Reaches
- Academic staff, division heads
What you can do here
- Add a course and bind it to a subject, a class and an academic year.
- Pick the framework that governs how it is assessed and graded.
- Open a course to set up its topics, assessments, exams and report-card comments.
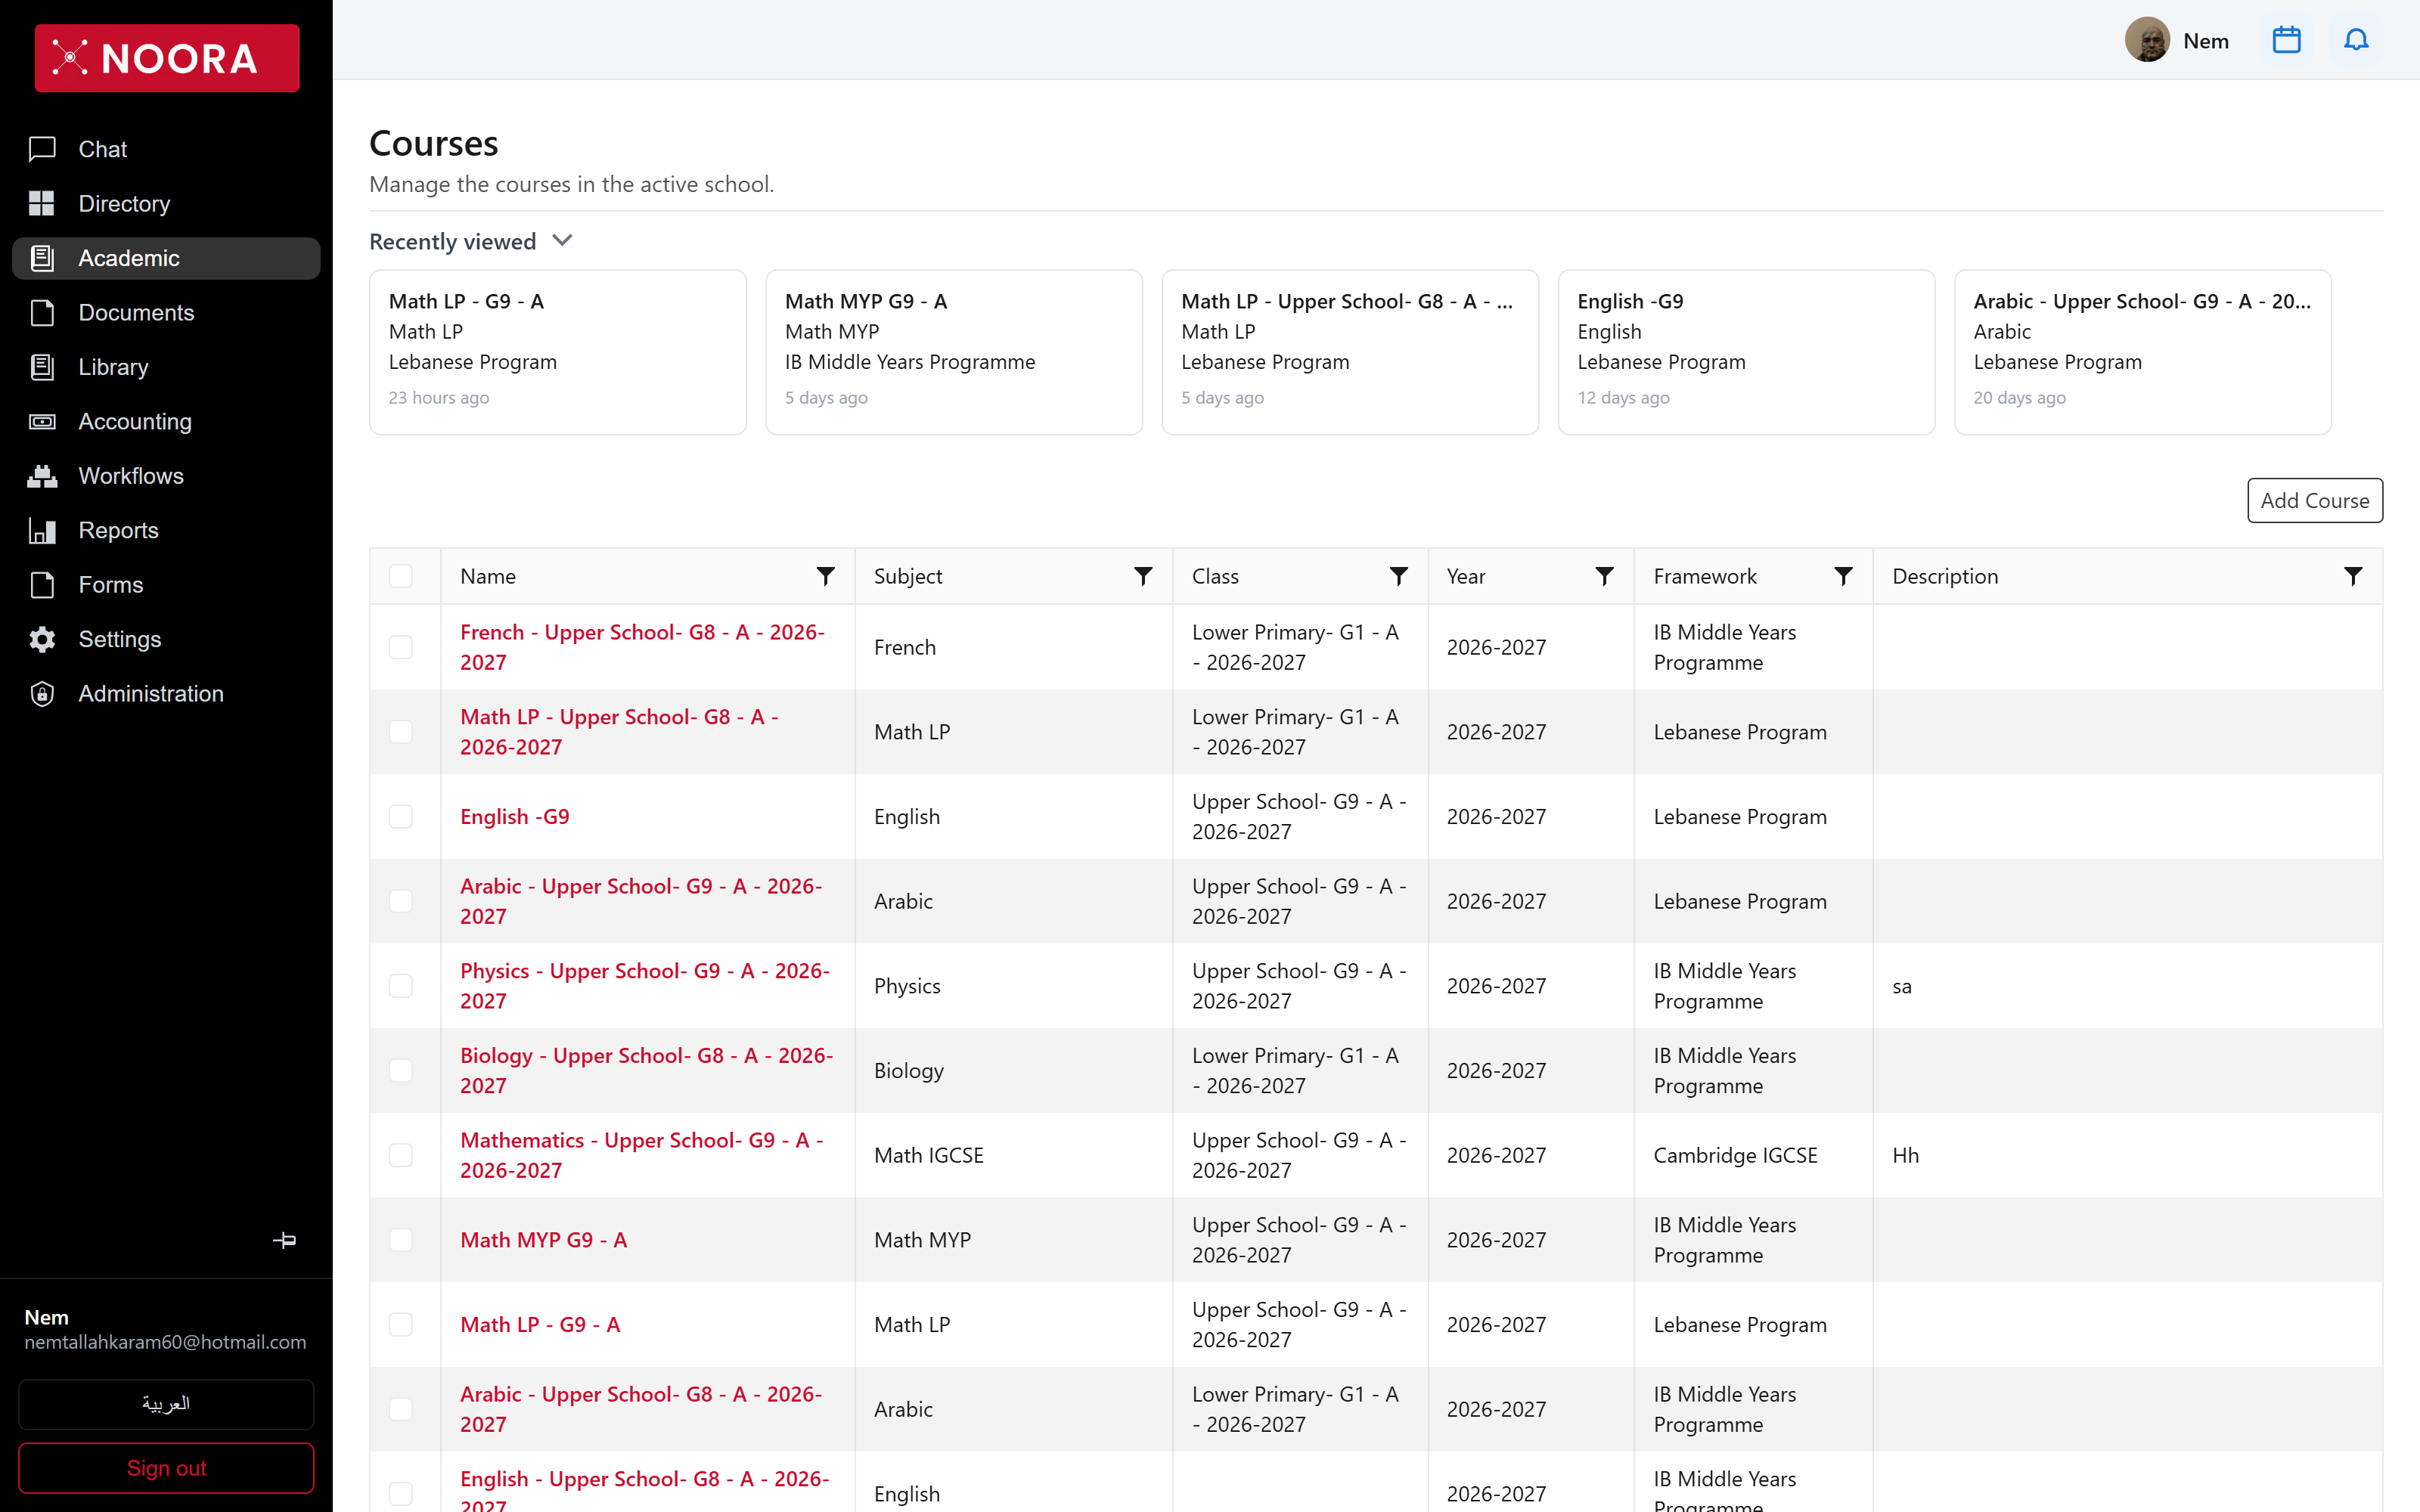
- Filter by subject, class, year or framework to audit what a class is actually taking.
What's on the grid
| Column | Holds |
|---|---|
| Name | Generated from a template you control — the default is {subject} - {class}, and it stays editable. |
| Subject | Arabic, Biology, English, French, Math LP, Math MYP, Math IGCSE, Physics… |
| Class | The class taking it, from Classes & sections. |
| Year | Academic year, so last year's course stays intact. |
| Framework | The curriculum and grading scheme — this drives the grade scale and the maximum score on a test. |
| Description | Free text for the course outline. |
The framework isn't a label. It sets the grade scale families see in Grades and the maximum score a test can be marked out of, so moving a course between frameworks changes how its results read.
Inside a course record
Opening a course is where the academic year actually gets built. The record is a set of tabs, and they run roughly in the order you use them — set the course up, plan the units, teach and share, evidence the learning, then mark and report.
| Tab | What it's for |
|---|---|
| Main | Course setup, plus a progress overview comparing plan against actual. |
| Calendar | This course's sessions on the shared scheduler. |
| Plan | Units, lessons and objectives, with planned dates. |
| Stories | What gets shared with families about this course. |
| Learning Evidences | Assessments and evidence of learning, with generated tests and criterion marking. |
| Grades | Published results for the course. |
| Attendance | Session-by-session attendance marks. |
| Notification Rules | Which events on this course notify families, and how. |
| External Resources | Links and material attached to the course. |
Main — setup and pace
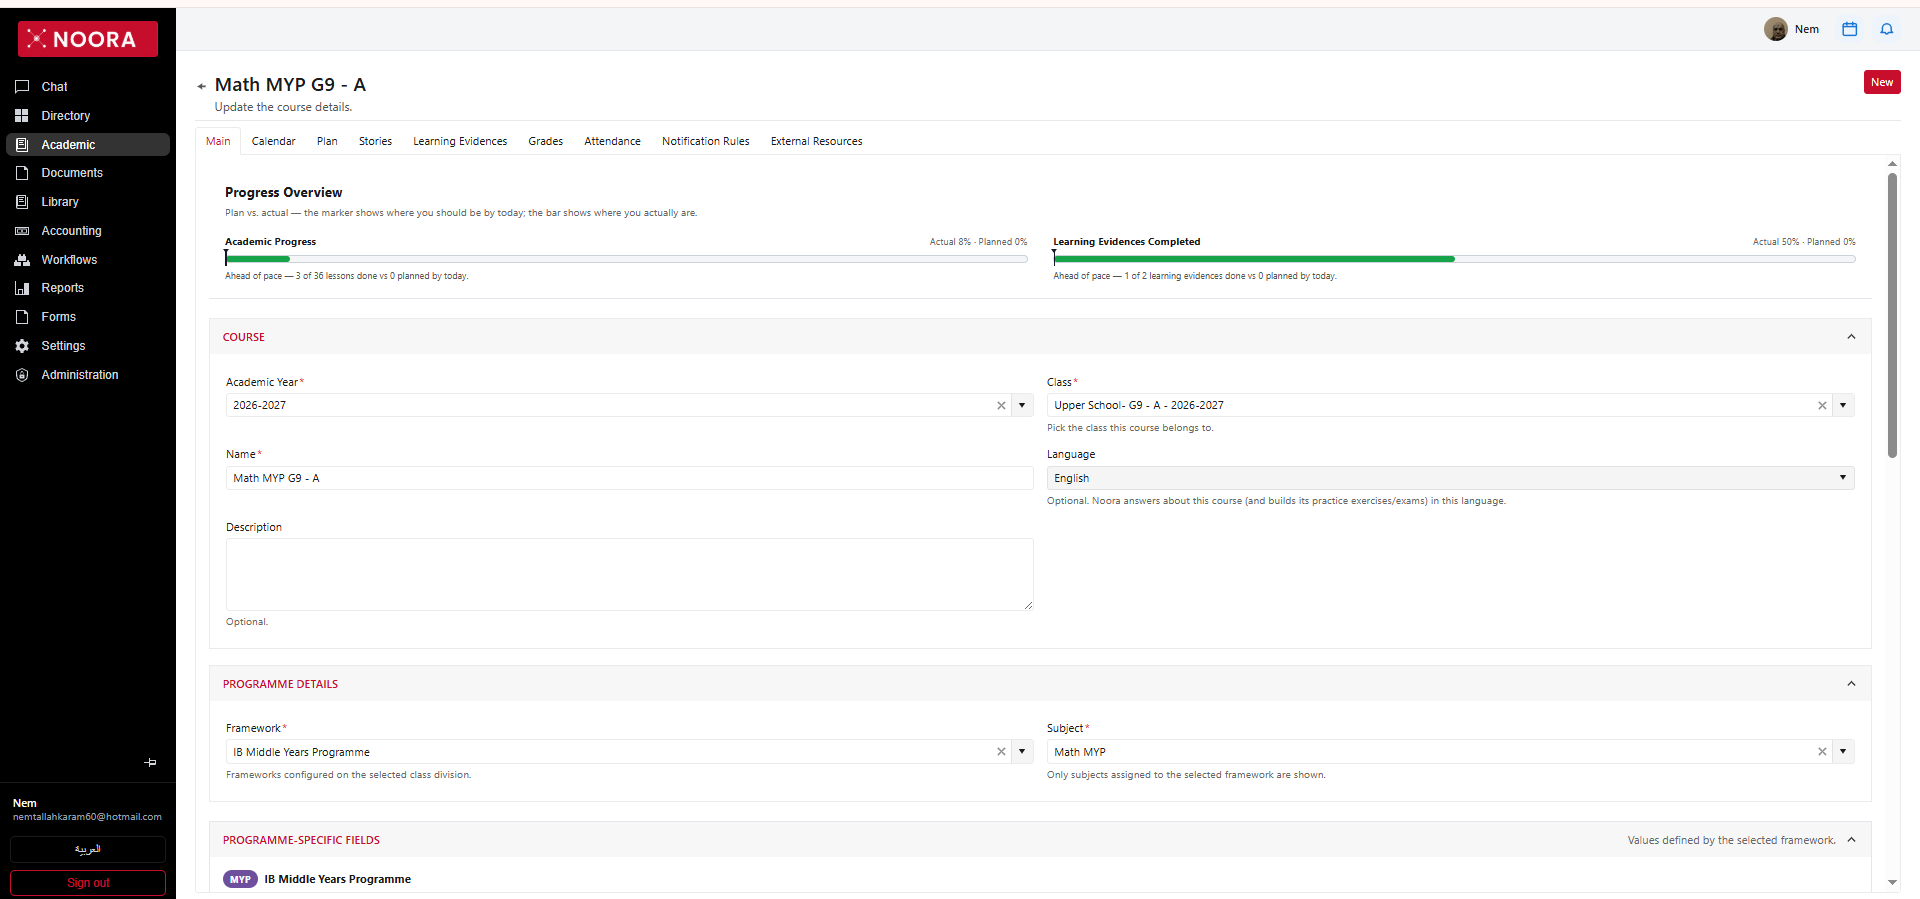
The top of the tab answers "are we on schedule?" before any field: Academic progress and Learning evidences completed each show a bar for where the course actually is and a marker for where the plan says it should be by today, then say it in words — ahead of pace — 3 of 36 lessons done vs 0 planned by today.
Below that, the course's own fields: academic year and class, name, description, and a language — which is not cosmetic. Noora answers questions about this course and builds its practice exercises and exams in the language set here. Programme details then binds the course to a framework and a subject, and the two are dependent: only frameworks configured on the class's division are offered, and only subjects assigned to the chosen framework. The framework then contributes its own programme-specific fields further down.
Plan — units, lessons and objectives
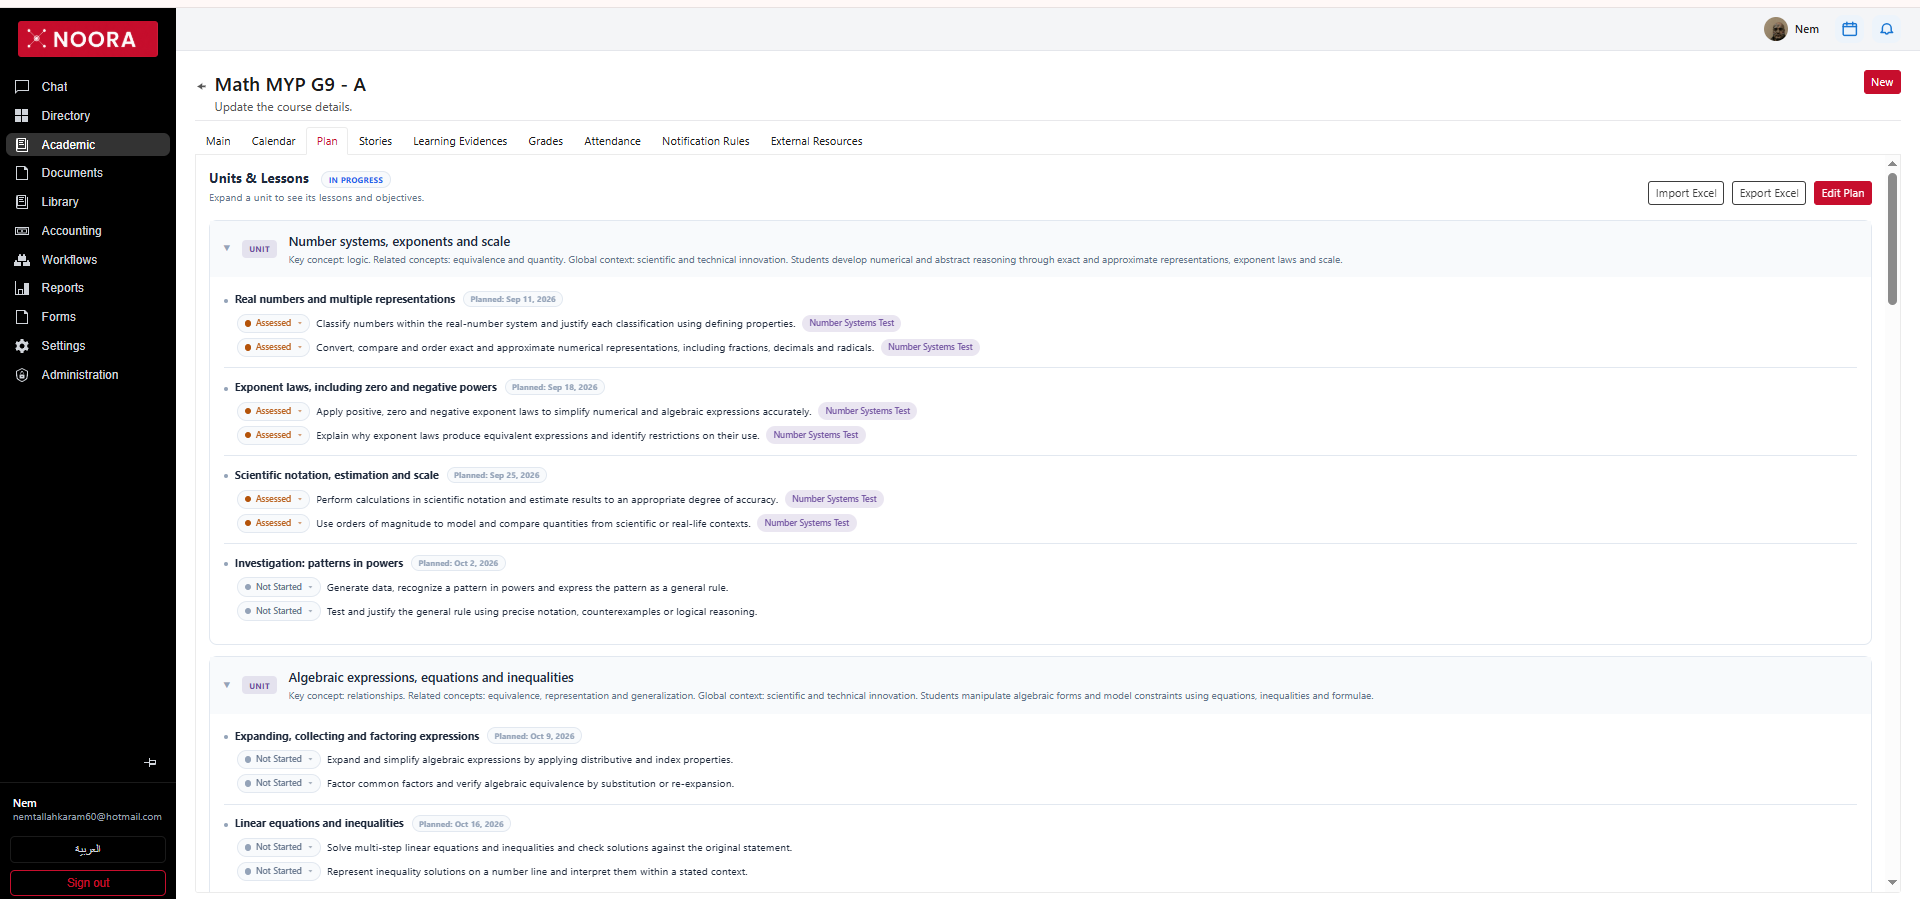
The plan is a three-level tree: units hold lessons, lessons hold objectives. A unit carries the framework's own planning vocabulary — for an MYP course that means a key concept, related concepts and a global context, alongside the statement of inquiry. Each lesson carries a planned date, which is what the progress bars on Main measure against.
Objectives are the unit of tracking. Each one has a status you set as teaching proceeds
(Not Started through to Assessed) and shows the assessment it is linked to, so an
objective and the test that evidences it stay visibly connected. Whole plans move in and out as spreadsheets via
Import Excel and Export Excel.
Stories — what gets shared, and who sees it
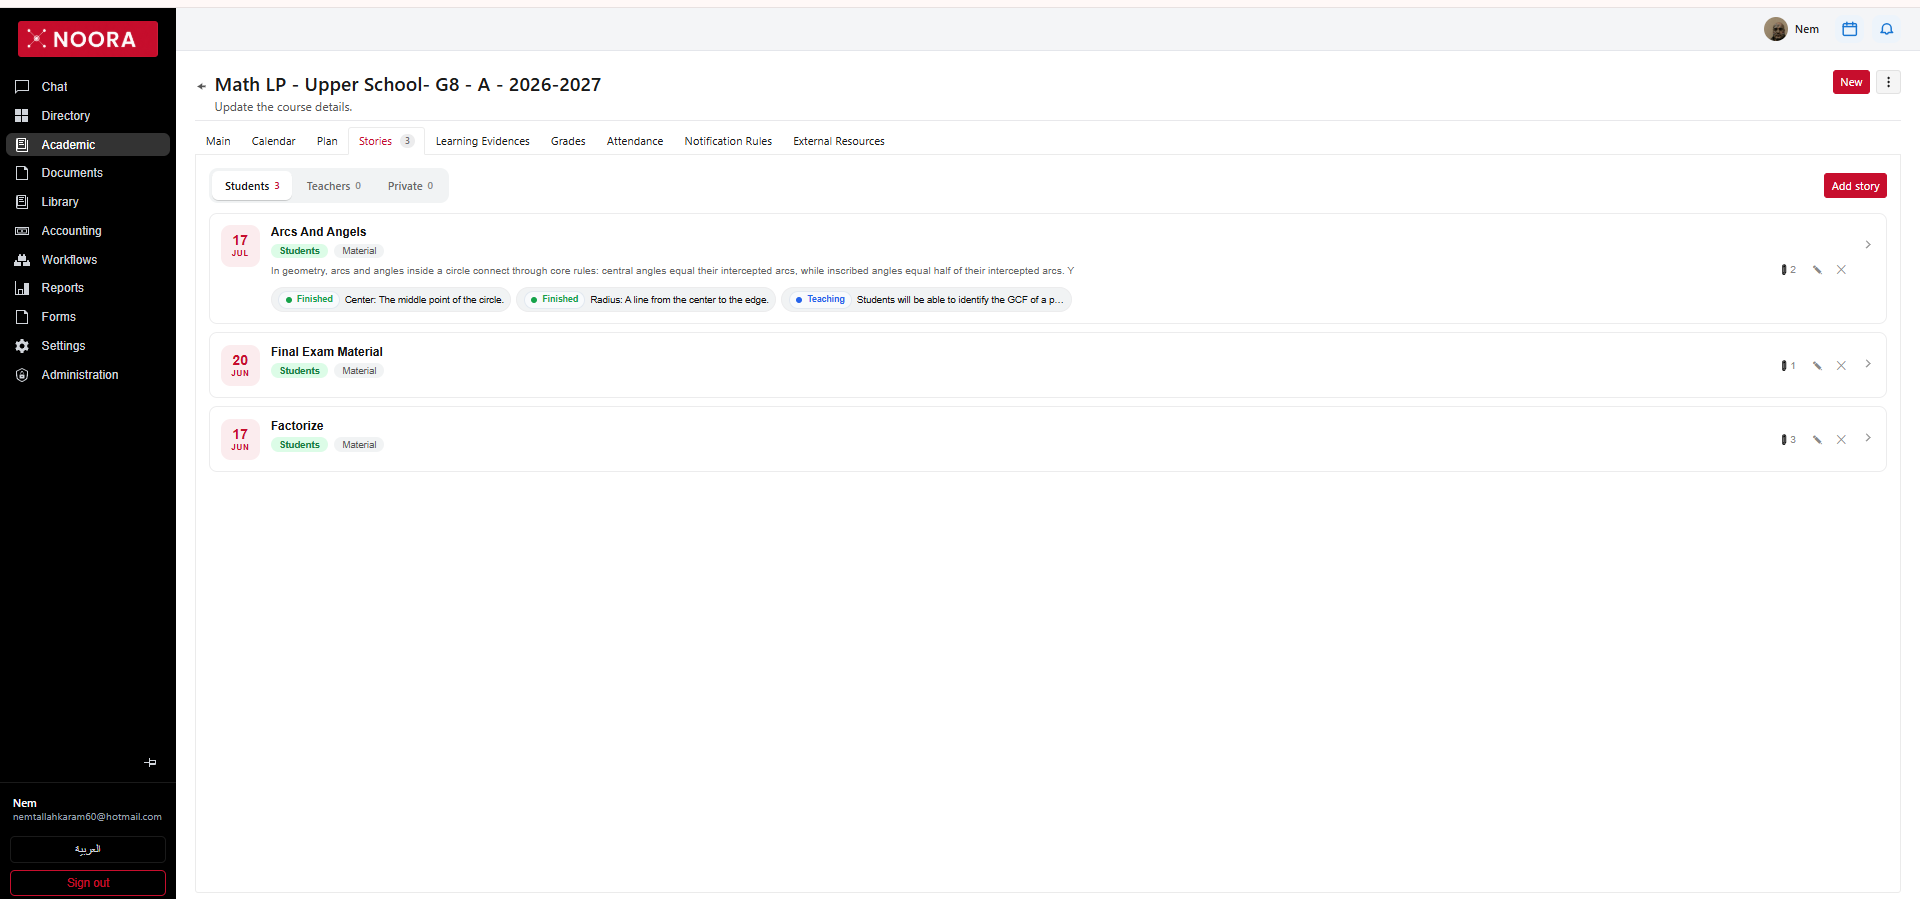
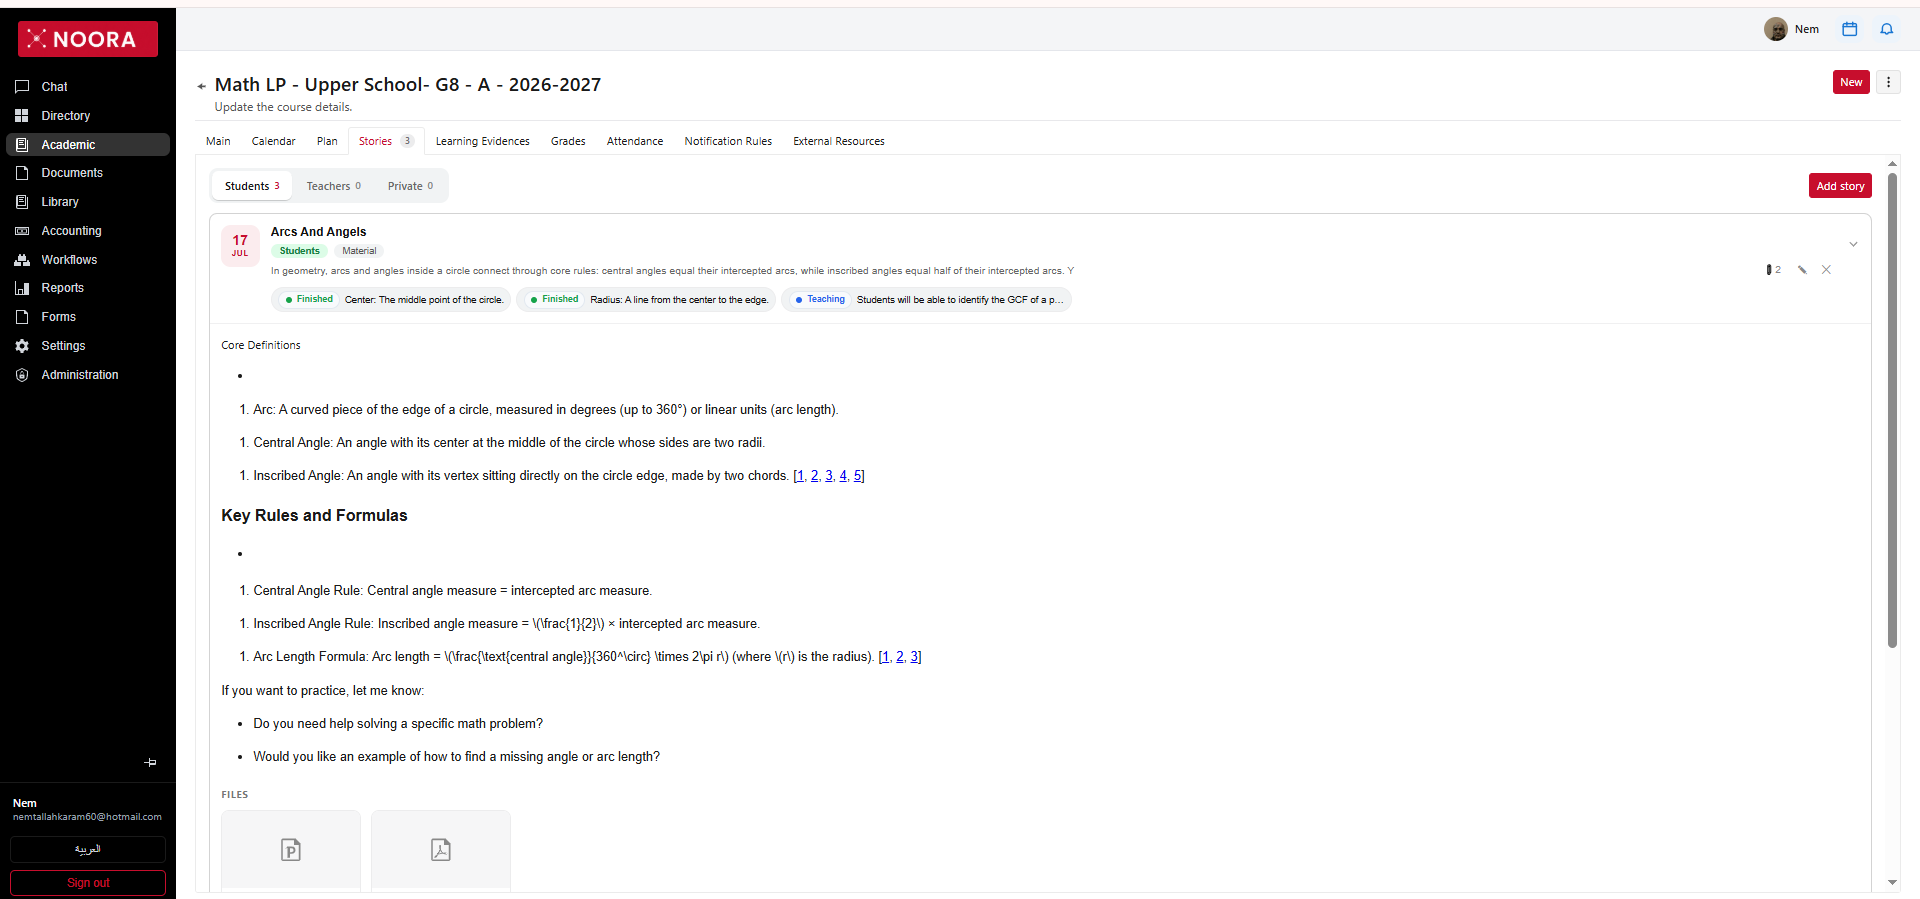
Stories are the course's outward voice, and each one is addressed. Three audience tabs — Students, Teachers, Private — separate what goes to families from what goes to colleagues and what stays with the author, each carrying its own count. A student-facing story is what appears to parents and students under this course in Course stories, which is where the portal's per-course story counts come from.
A story row carries its date, a title, its audience and type (Material, for instance), a
one-line preview, and how many files are attached. What makes it more than a message board is the row of
objective chips underneath: a story links to the plan objectives it covers and shows each one's teaching status
— Teaching while it is being taught, Finished once it is done. Sharing material and
recording what was actually taught are the same action.
Expanding a story opens the whole thing: structured explanation with headings, definitions and rules, numbered source citations, suggested follow-up questions for a student who wants to go further, and the attached files — slides, PDFs, anything the lesson needs.
Learning evidences
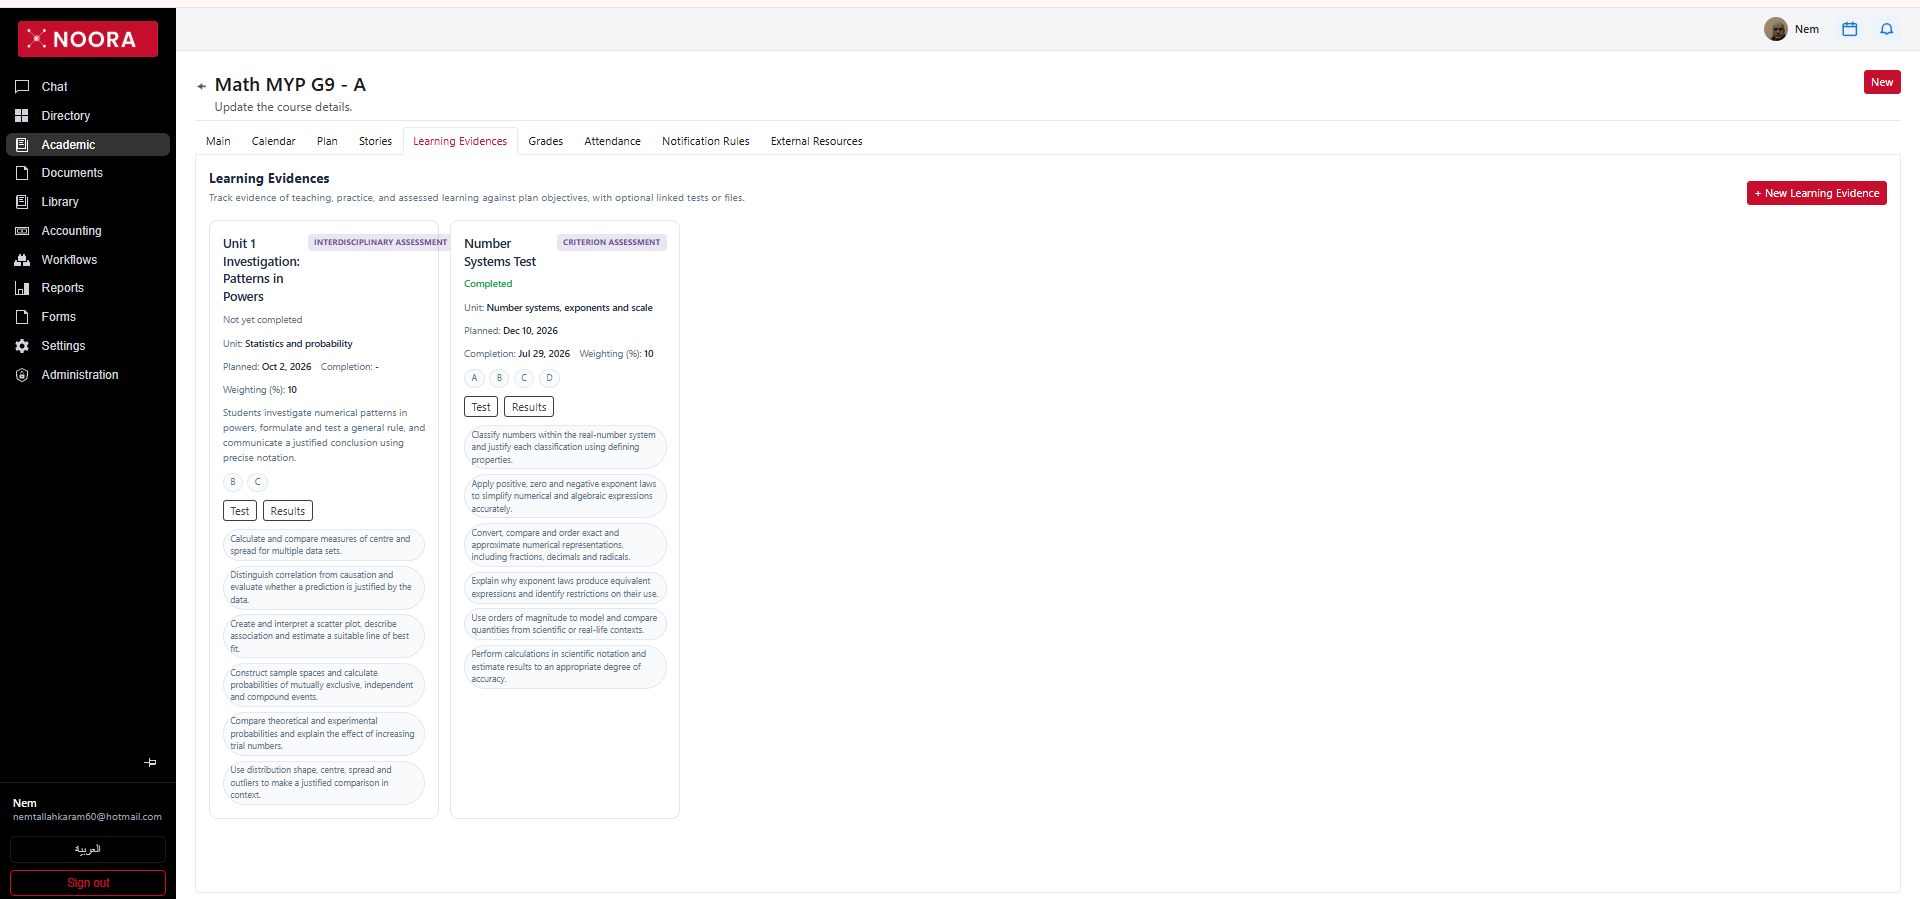
A learning evidence is one piece of assessed learning: what it covers, when it was planned and
completed, how much it weighs, and which framework criteria it is marked against. Each card names its unit, its
weighting, its criteria (A–D for MYP) and the plan objectives it evidences — and it is
typed, so an interdisciplinary assessment and a criterion assessment are distinguishable at a
glance.
The test is generated from the material
You don't author the paper question by question. Noora generates the test from what the assessment already declares — the material in the plan, the criteria selected on the evidence, and the objectives to be included — so the questions are traceable to the syllabus rather than invented alongside it. Question types mix freely: multiple choice, true/false, ordering, and written answers, each carrying its own point value.
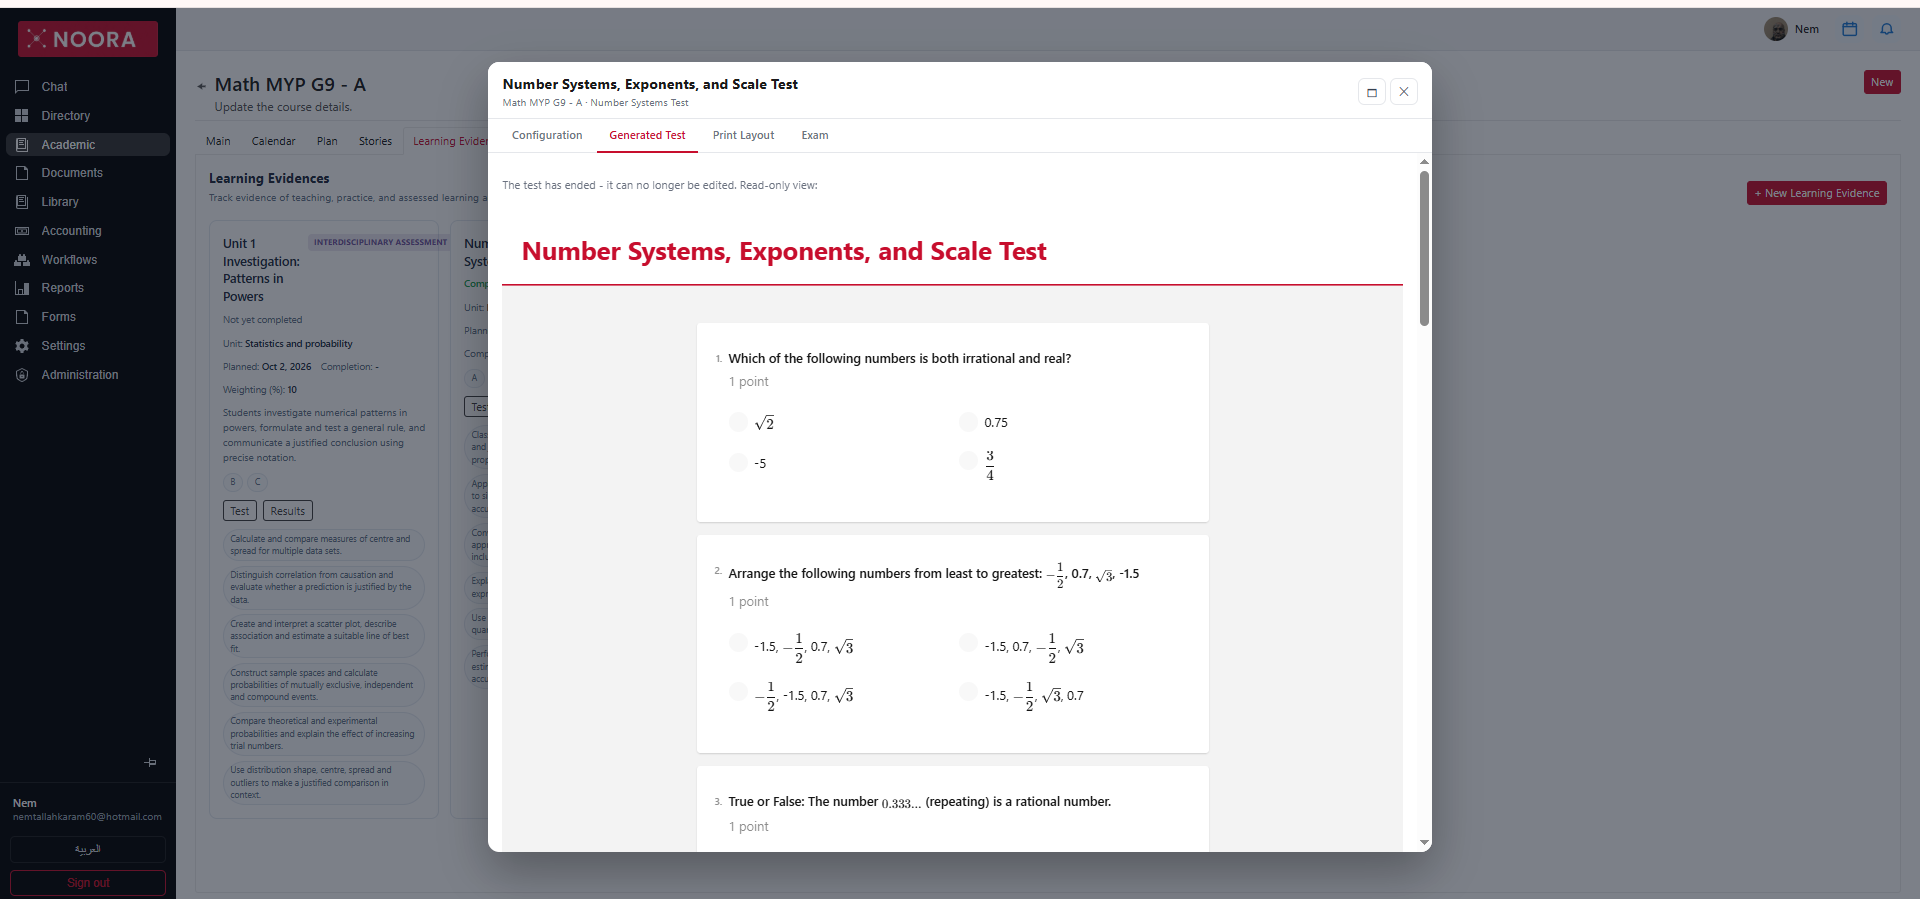
Once a test has ended it becomes read-only — the test has ended, it can no longer be edited — so the paper students actually sat is the paper you review afterwards.
Equations and diagrams are real content, not pictures
A maths or science paper is mostly notation, and the usual workaround in school software is to paste a screenshot of it. Noora doesn't: equations and diagrams are first-class content that the platform composes, renders and carries through to print.
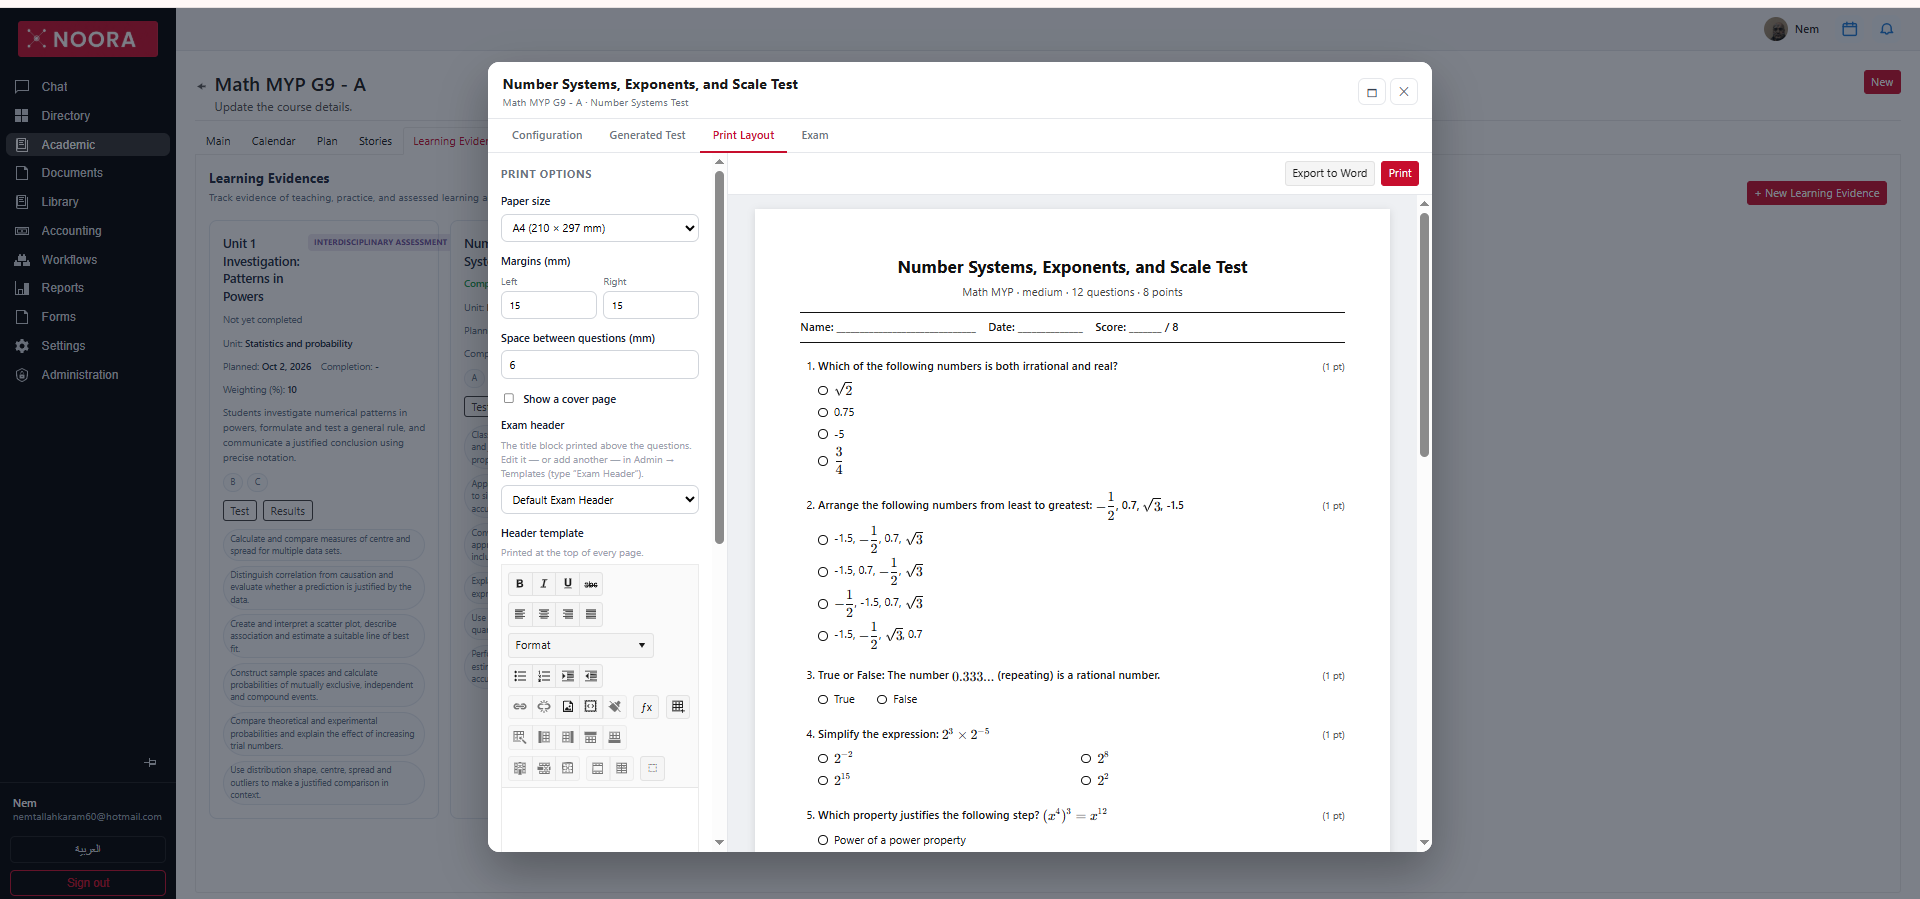
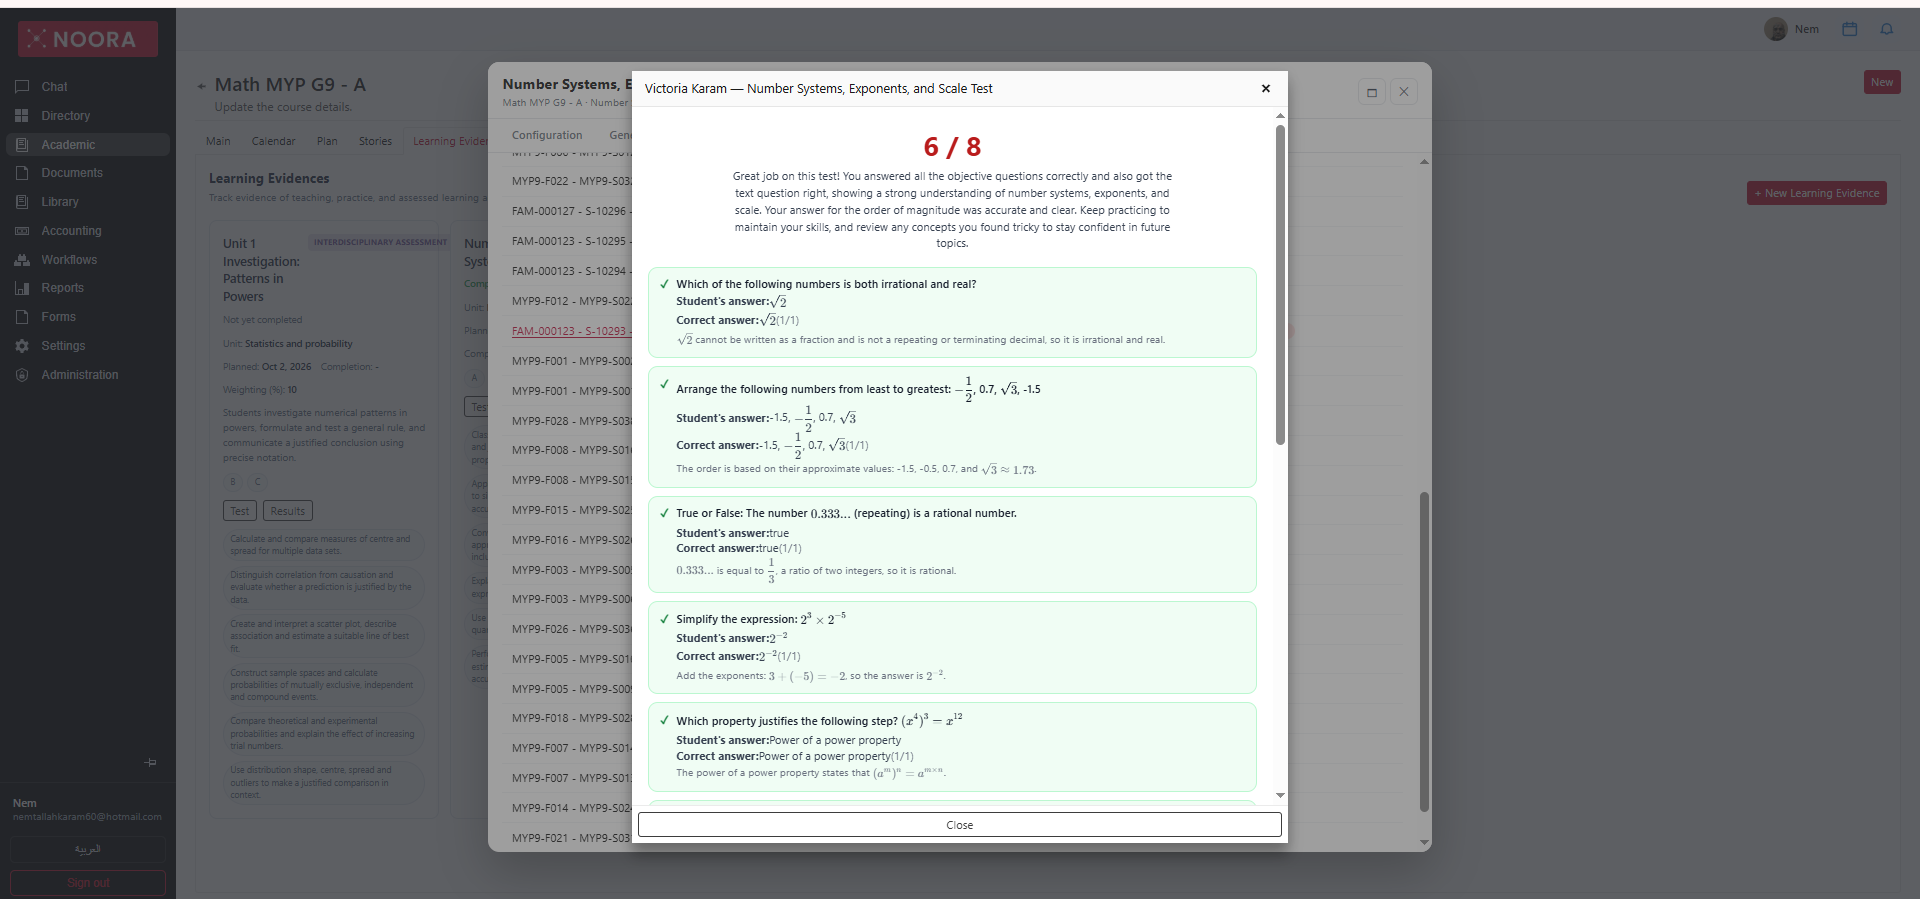
- Mathematical notation is typeset properly wherever it appears — in the question, in the answer options and in the marking view. Radicals, fractions, exponents and mixed expressions (23 × 2−5, (x4)3 = x12) read as mathematics, not as ASCII approximations.
- Chemistry is handled the same way, so a chemistry paper can carry chemical equations and formulae as text the platform understands rather than as flat images.
- Maths and physics diagrams are drawn by the platform through Add figure — coordinate geometry and function plots, and physics constructions such as the optics ray diagram below, complete with labelled rays, focal points and the principal axis.
The figure editor has a Designer for building the diagram and a Preview for checking it before saving. Because a figure is generated from a recipe rather than uploaded, it stays editable: click it on the design surface and it opens again with its construction intact. What students sit is a frozen snapshot of the figure, so every student sees exactly the same diagram even if the recipe is edited afterwards.
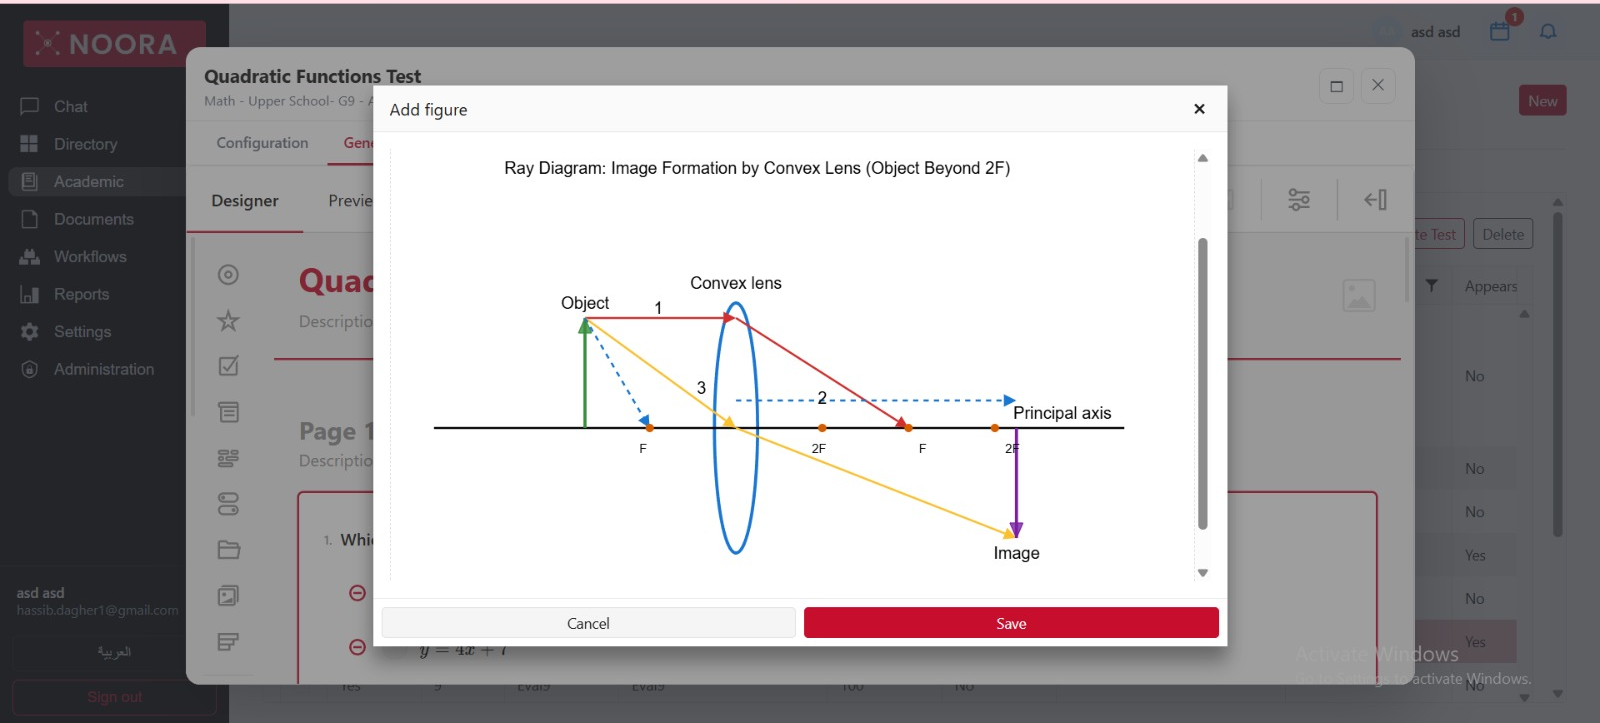
This is what makes the paper portable. Because the notation and the figures are content rather than screenshots, the same generated test survives being printed or exported to Word without turning into a page of pasted images.
Print it, or export to Word
The same generated test can leave the screen as paper. Print layout controls page size, left and right margins, the space between questions and whether a cover page is included, then previews the result — title block, the school's exam header, and a name/date/score line. Export to Word hands you an editable document; Print goes straight to paper.
The header itself is a school-level template rather than something retyped per test: pick a saved exam header, or edit one in Administration under templates of type Exam Header.
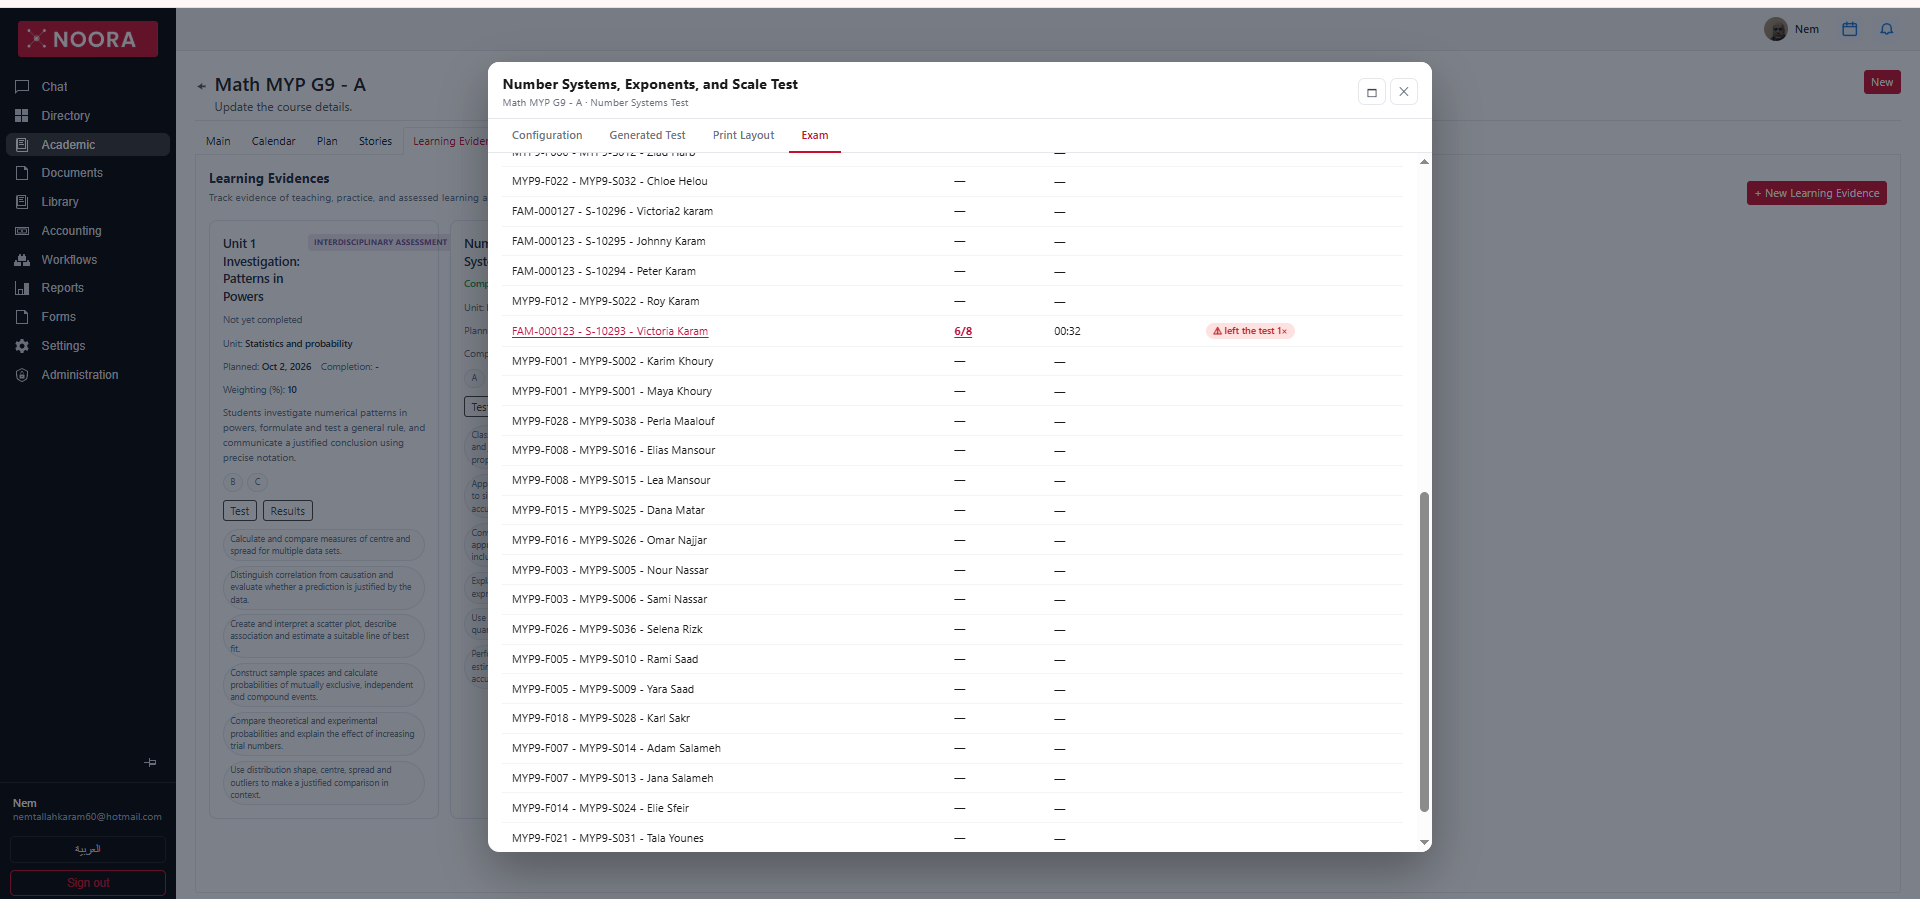
Sitting it
The Exam tab is the live roster: every student in the class with their score, the time they took, and any integrity flags raised while they worked — a student who navigated away is marked left the test with a count. Students who haven't sat it read as a dash rather than a zero.
Opening a student's score gives the full paper back: their answer against the correct one, mark by mark, each with a short explanation of why the correct answer is correct — and an overall note written to the student.
Marking by criterion
Results is where the assessment is marked and the marks are locked. The header states the result format (level out of 8 for MYP), the weighting, the status and the class average. Then, per student, one row per criterion — a level and written criterion feedback.
This is the payoff of generating the test from criteria and objectives: because each question is already tied to them, the result breaks down the same way. Generate comments (AI) proposes a level and feedback per criterion, each marked as a proposal, and cites the evidence underneath — which questions supported the level and which were left blank. Staff adjust the levels and wording; the proposal is a draft, not a verdict.
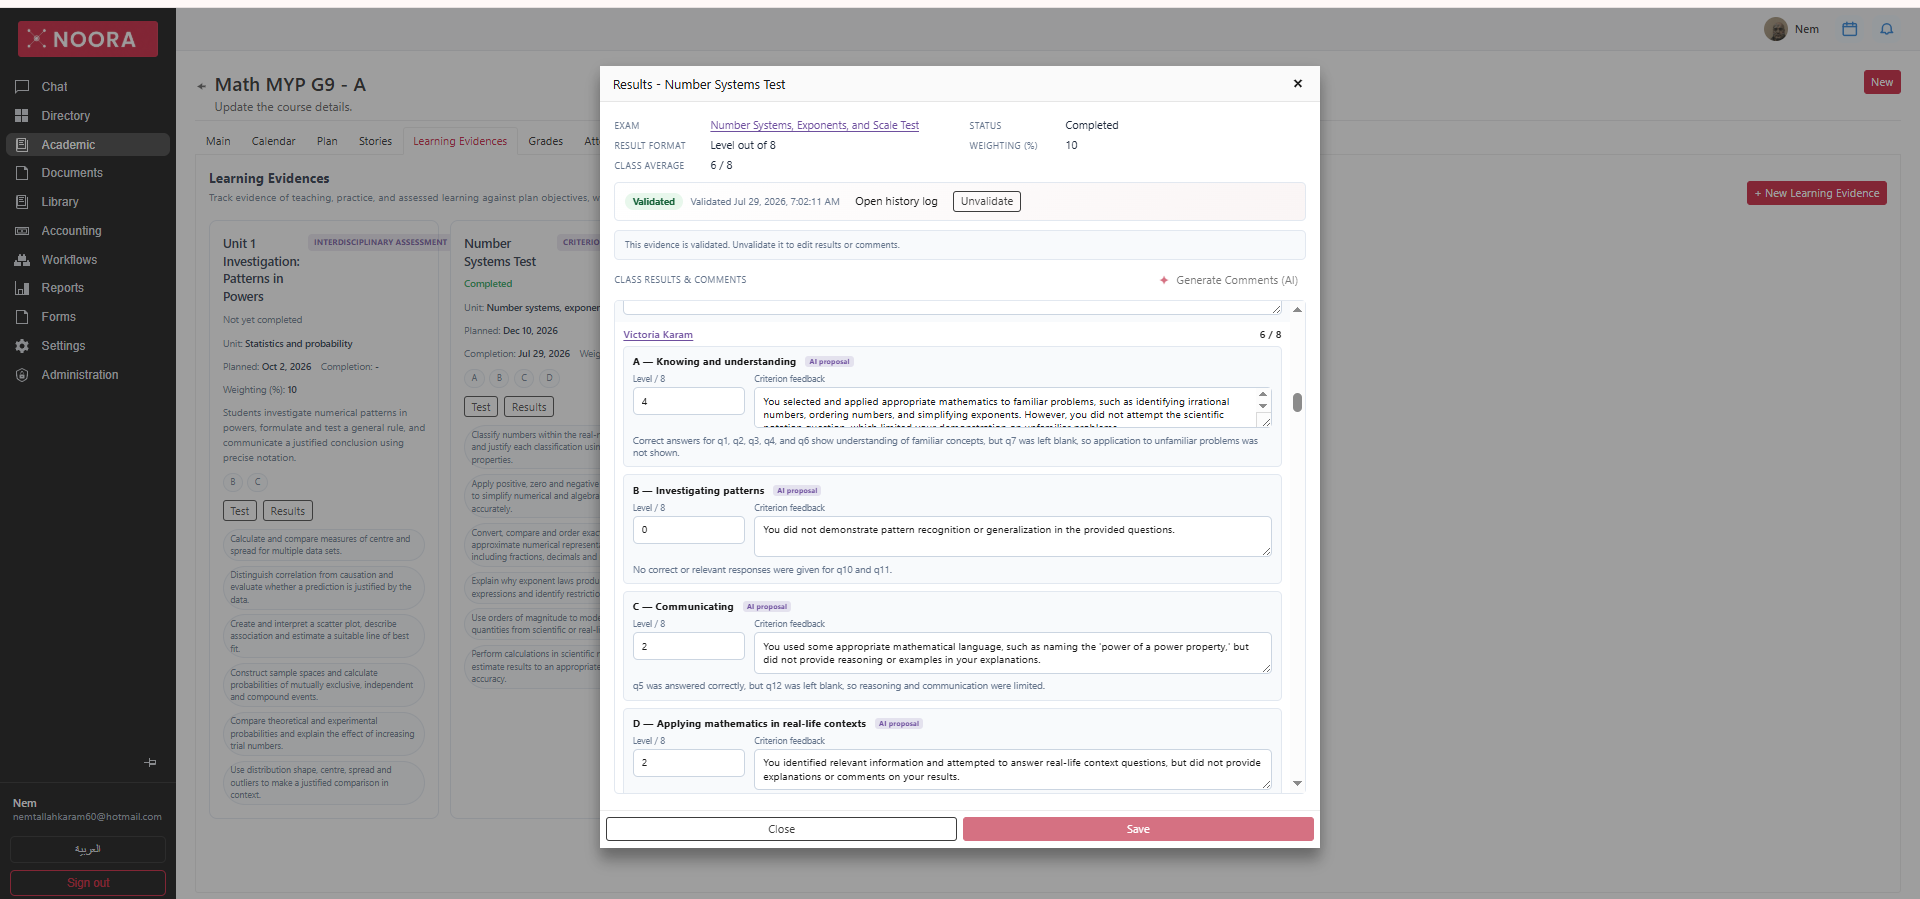
A validated evidence can't have its results or comments edited — Unvalidate first. Validation is timestamped and keeps a history log, so who changed a published mark, and when, stays answerable.
Grades
The grades tab collects the course's published results — each assessment's contribution at its own weighting, and the course grade that comes out of them on the framework's scale. This is the source of what families read in Grades and what a report card merges, so a mark reaches a parent only after it is published here.
assets/img/course/grades.pngCourse Grades tab showing published results and the resulting course gradeAttendance
Attendance is recorded per session against the course, with the four marks the rest of the platform reports on: present, late, absent and no-show. Those marks drive the attendance rate on Student 360 and trigger the parent alerts whose templates are set in Settings — mark a student absent here and the family is told, using the school's own wording.
assets/img/course/attendance.pngCourse Attendance tab showing session attendance marks per student